The Census Bureau Uses Its Own Data to Increase Response Rates, Helps Communities and Other Stakeholders Do the Same
Entrepreneurial researchers and officials at the U.S. Census Bureau created a new interactive mapping tool in early 2018 called the Response Outreach Area Mapper (ROAM) that is enabling better resourcing decisions and outreach to increase self-response rates for the 2020 Census and many other surveys. The team started with a valuable yet vast and unwieldly data asset. Through multiple design decisions in response to internal and external needs, the team produced an application that resulted in wider use of authoritative Census Bureau data, not only to improve the Census Bureau’s own operational efficiency, but also for use by tribal, state, and local governments, as well as national and local partners and other community groups. Other agency data practitioners can learn from the Census Bureau team’s experience communicating technical needs to non-technical executives, building analysis tools with widely-used software, and integrating efforts with stakeholders and users.
Self-response and the Low Response Score
Every ten years, as mandated by Article I, Section 2 of the U.S. Constitution, a full count of America’s population is conducted. Today, this work is completed by the Census Bureau within the U.S. Department of Commerce. Counting some 330 million people is no trivial task, and the Census Bureau has developed many different methods and approaches to collecting the most accurate information possible, including response modes such as the internet and telephone.
Census staff have learned the crucial role of ‘self-response’—the idea that when a census form is sent to an address, that form, ideally, should be filled out, without further government prompting, by someone knowledgeable who lives at that address. When no one from the address responds, the Census Bureau has to conduct the costly operation of sending interviewers to obtain a response. The cost of these nonresponse follow-up operations is considerable. The Census Bureau, therefore, spends a good amount of time and effort convincing individuals to self-respond.
Given the resources involved, it makes sense to target efforts towards those households that are less likely to self-respond. For the 2020 Census, the Census Bureau is doing just that. A metric called the Low Response Score (LRS) identifies what percentage of households in a given census tract is unlikely to self-respond—you can think of it like this—the higher the score, the harder to count.1 The LRS is generated through regression analysis of 25 census tract-level statistics, such as the percentage of individuals in a certain age bracket.
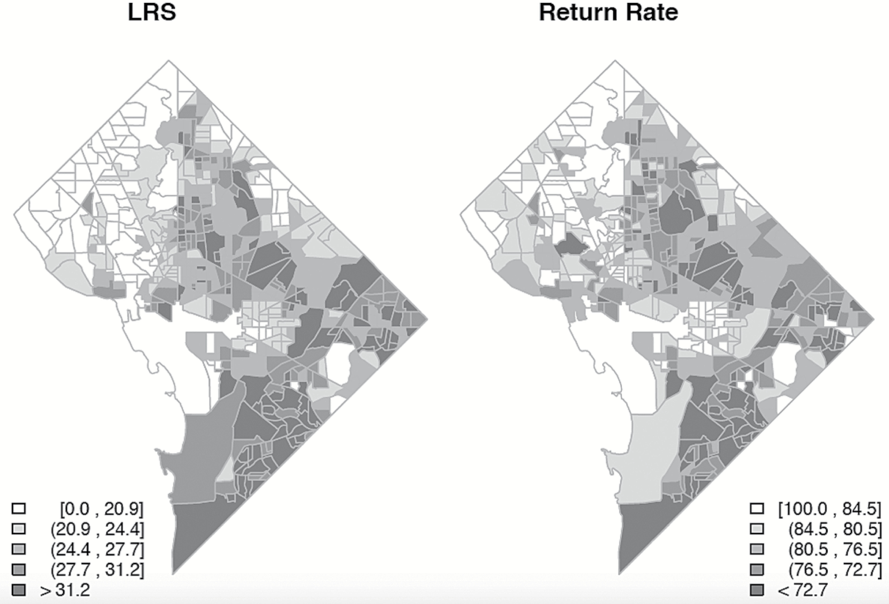
 A comparison of Low Response Scores with actual 2010 Census return rates reveals the high credibility of the LRS as a predictor of census tracts with high levels of non-self-responding households. Washington DC census tracts are depicted here.
Public Opinion Quarterly, Volume 81, Issue 1, 1 March 2017, Pages 144–156, https://doi.org/10.1093/poq/nfw040
Knowing the LRS of a given census tract allows Census Bureau staff to make more efficient resourcing and personnel decisions. In fact, it is just one example of how the Census Bureau uses its own data in making critical operational decisions. The LRS and the underlying data used to calculate it are found in the Census Bureau’s Planning Database (PDB). The PDB is a collection of 2010 Census variables and a subset of household and population estimates collected by the annual American Community Survey. The PDB is a wealth of information for those charged with planning and executing the decennial census and other surveys.
ROAM gives the PDB mass appeal
As useful as the PDB is, leveraging it to make decisions at a geographic level requires the ability to take the data and link them with geospatial data. Hence the introduction of the ROAM application which expanded the PDB’s utility to a much broader group of analysts and other users.
In 2017, staff at the Census Bureau requested a map of the LRS to help inform operations. The team decided to expand the vision, making not just a static choropleth map of the LRS, but an interactive web map prototype, which could facilitate internal operations and be used to gauge whether others would benefit from such a tool.2
Before the team could turn the prototype into a production-ready tool, however, they had to win the approval and enthusiasm of Census Bureau leadership. They quickly learned the importance of crafting a non-technical elevator speech, along with examples to help make the case. Without clear communication to leadership about the benefits of the project, it would have been impossible to secure the budget to procure hardware and complete the certification for the platform used to build ROAM. Showing a prototype tool wasn’t just about attracting the attention of senior level management. It was also useful to get the reaction of people whose work could directly benefit from the creation of this tool.
“We spent a lot of time presenting and demonstrating the tool around the building, showing it to various smaller groups of people to get reactions. Some of these reactions served to better the tool, and others served to strengthen the argument for its creation.”
– Suzanne McArdle (Cartographic Products and Services Branch, Census Bureau)
ROAM empowers stakeholders, inside and outside of federal government
As soon as ROAM went live in February 2018, users inside and outside of the Census Bureau started gaining value from it. For example, ROAM helped Jamey Christy in Field Operations to better allocate his staff. He explained that part of his job is to hire 1,500 specialists to work with hard-to-count communities—homeless individuals, migrant farm workers, and others who might not otherwise prioritize responding to census forms. Typically, a manager would simply allocate the specialists proportionally according to the percentage of population dwelling in each census tract. Using ROAM, however, Christy is able to concentrate specialists in census tracts with a high LRS.
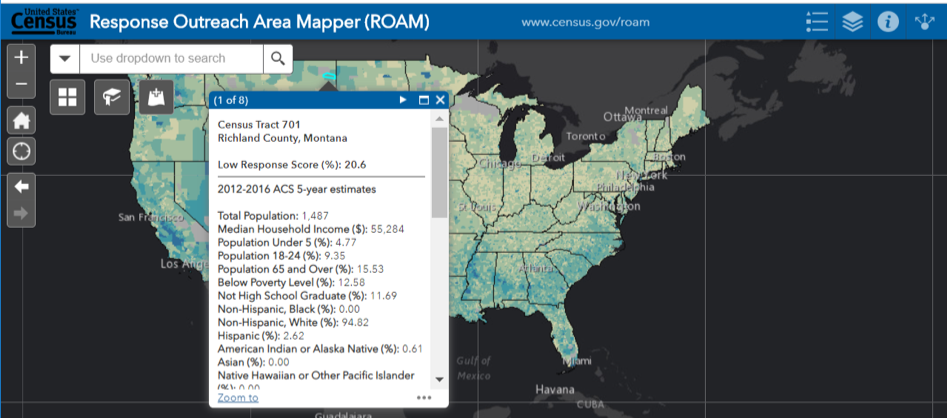
 Selecting a census tract on the Response Outreach Area Mapper reveals its LRS, an indication of how likely any household is to not self-respond to a Census Bureau survey, along with socioeconomic and demographic characteristics within that census tract.
The LRS, as packaged in ROAM, has also become a data-based decision-making tool for non-federal organizations, providing them with objective data validated by the Census Bureau. Given the representation and financial ramifications—seats in Congress and hundreds of billions of federal dollars are allocated according to decennial census information—state governments and other organizations invest a lot of resources in getting their residents tallied properly. California, for instance, has “already allocated more than $100 million on efforts aimed at getting all its residents counted” in the upcoming census, with other states following suit.3 ROAM helps these governments, especially those that lack the geospatial information programming capacity to work with raw PDB data, to allocate their census programs efficiently.
Several organizations have taken it a step further, building on the firm foundation of the PDB and ROAM. California built its own tool, called the Statewide Outreach and Rapid Deployment (also known as SWoRD) tool on top of PDB data and using ROAM as an example. New York City and others have taken their own similar approaches. To help facilitate value creation on top of ROAM, its underlying data services are made available by the Census Bureau at census.gov/roam as a RESTful API (an Application Program Interface that responds predictably to other computers’ requests made over the internet).
An evolving tool
With each new user, the Census Bureau gains another perspective on how ROAM can be improved. At one conference, an advocate for young children highlighted four variables that could be included in the LRS regression to improve its accuracy, including the percentage of children without health insurance in a census tract and the percentage of three- and four-year-olds enrolled in school.
“As we roll this out, we don’t just hear from users saying they are using ROAM to answer their questions, but also telling us what correlates they’d like added. We are being guided by our users as to how we can add value as we move along.”
– Kathleen Kephart (Center for Behavioral Science Methods, Census Bureau)
The LRS is also bound for updates. The 2020 Census will feature new response modes, including the internet, leading to challenges in adapting the LRS to that mode, but also creating opportunities for calibrating it further. The Census Bureau has also been looking into providing confidence intervals to the LRS, helping practitioners understand how strong its estimates are for any given census tract.
Postscript
To learn more, check out the PDB’s website or email census.pdb.questions@census.gov.
Footnotes
-
Census tracts are relatively permanent statistical subdivisions of a county or county equivalent. ↩
-
A choropleth map is type of thematic map in which geographic areas are colored or shaded based on the value of a particular variable within each geographic area. ↩
-
https://www.rollcall.com/news/congress/census-states-spending-2020 ↩

