The Mapping Medicare Disparities Tool
The Centers for Medicare & Medicaid Services’ Office of Minority Health (CMS OMH) is focused on eliminating health disparities by improving the health of minority populations. The path to healthcare equity starts with a better understanding and awareness of health disparities. Without the knowledge about the size of the problem or its root causes, it is difficult to develop solutions.
With its Mapping Medicare Disparities Tool, CMS OMH harnessed the power of millions of data records while protecting the privacy of individuals, to build an easy-to-use tool for better understanding this important real-world problem.
Build a tool for understanding the data
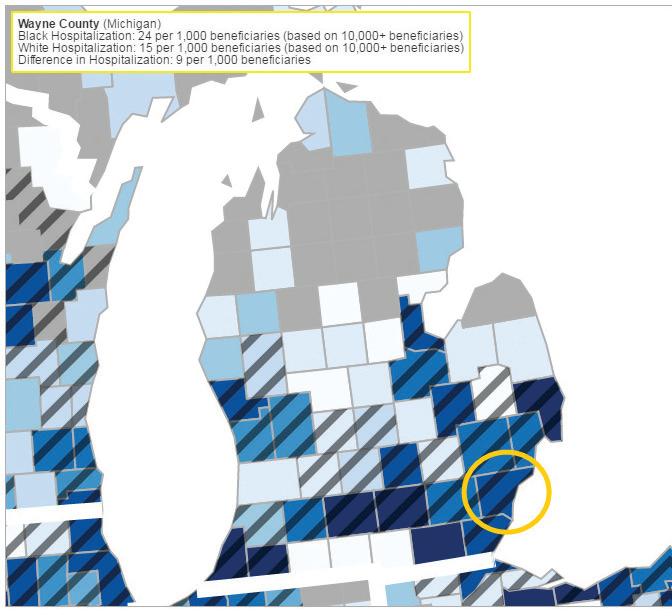
 A user pulls up the Population View of the MMD Tool to observe the difference in hospitalization rates, 9 per 1,000 people, between White Medicare beneficiaries and Black Medicare beneficiaries in Wayne County, Michigan.
To provide user-friendly access to data on areas where Medicare populations exhibit health disparities and amplify awareness of health disparities, CMS OMH launched the Mapping Medicare Disparities (MMD) Tool in March of 2016.
The MMD Tool is an interactive map identifying geographic areas of disparities between subgroups of Medicare beneficiaries. It also features downloadable maps, tables, and trending data.
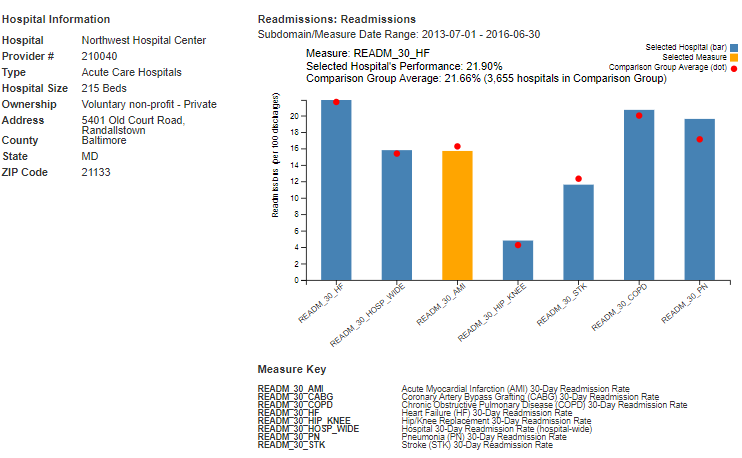
The tool has two views. The Population View identifies disparities by geography, race, and ethnicity in chronic disease prevalence, costs, hospital and emergency department utilization, readmission and mortality rates, potentially disabling conditions, preventable hospitalizations, and preventive services. In addition, the data can be viewed by sex, dual status, and age. The Hospital View provides over 50 quality measures for analyzing and comparing hospitals based on geography, hospital type, and hospital size.
Different stakeholders, different uses
The MMD Tool allows users to identify health disparities so that they can evaluate them and prioritize improvements. The MMD Tool also empowers beneficiaries to understand and compare their own health outcomes to those of others in their communities. Researchers and state/local health representatives can identify disparities in Medicare to inform the design of targeted interventions. Hospitals can analyze their quality performance and compare themselves to other similar hospitals.
 A user looks into detailed information about Baltimore’s Northwest Hospital Center.
Protecting privacy while gaining insights
The privacy of the Medicare data the MMD Tool is built upon is protected by the privacy regulations as PHI (protected health information), which is individually identifiable health information held by covered entities and their business associates.1 The MMD Tool extracts value from the aggregation of Medicare beneficiary data while still putting privacy first, performing a series of checks and data suppression steps before offering results to MMD Tool users. For example, if a user selects characteristics that would yield a population of fewer than 11 beneficiaries, the MMD Tool will conceal the result to protect privacy (you can read more about the approaches to protecting beneficiaries’ data on the FAQ page).
Plan for the tool to evolve
The MMD Tool continues to grow in sophistication and value. Most recently, differences between rural and urban counties within each state were incorporated to allow users to view and compare health outcomes, spending, and utilization rates. Additionally, four opioid use disorder indicators were added to the Population View. In the future, CMS OMH plans to update the Hospital View with additional enhancements, including additional quality measures. A forthcoming Trending View will also allow users to visualize emerging developments.
The CMS OMH team is continuing to reach out to stakeholders who might benefit from the MMD Tool and to determine how users can provide feedback to improve the MMD Tool.
Postscript
CMS OMH hopes that others will learn from the MMD effort, converting millions of data records into an interactive, user-friendly tool to identify health disparities. If you are interested in sharing your experience or have questions, ideas, or suggestions, please email the team at HealthEquityTA@cms.hhs.gov.
Footnotes
-
These regulations are promulgated under the Health Insurance Portability and Accountability Act of 1996 and the Health Information Technology for Economic and Clinical Health (HITECH) at 45 CFR part 160 and subparts A and E of part 164 (the HIPAA Privacy Rule regulations). ↩

